Scatterplot
noun
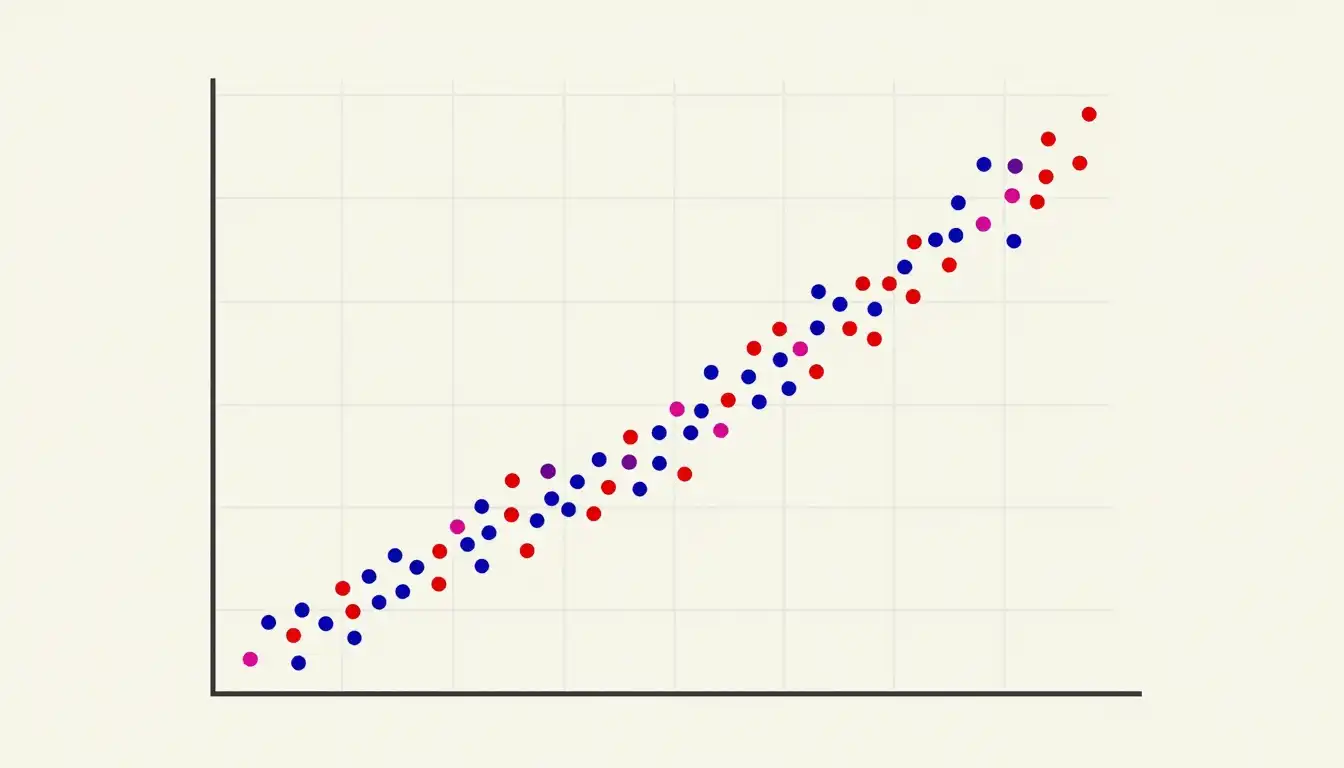
A type of graph that uses dots to represent the values obtained for two different variables, one plotted along the x-axis and the other plotted along the y-axis.
The scientist created a scatterplot to show the relationship between temperature and plant growth.
Often appears as...
- scatterplot analysis
- create a scatterplot
Usage tips
Neutral
General
Definition 1 of 1
Visual Representation
A scatterplot provides a visual representation of data, helping to easily see relationships between variables.

In the scatterplot, it is clear how the increase in one variable affects another.
Identifying Trends
Scatterplots are helpful in identifying trends and correlations in the data.

The scatterplot showed a positive correlation between hours studied and exam scores.
Data Interpretation
Learn to interpret the data presented in a scatterplot and understand what it signifies about the relationship between variables.

By analyzing the scatterplot, the researcher concluded that there was a significant relationship.
Compare with
histogram
Never forget "Scatterplot"
Humans forget easily. That's why you should download WordUp: Smart reminders, word games, AI practice, and much more!


WordUp Chrome Extension
As you browse the web instantly look up words you don’t know.
Get Chrome Extension