Chart
noun
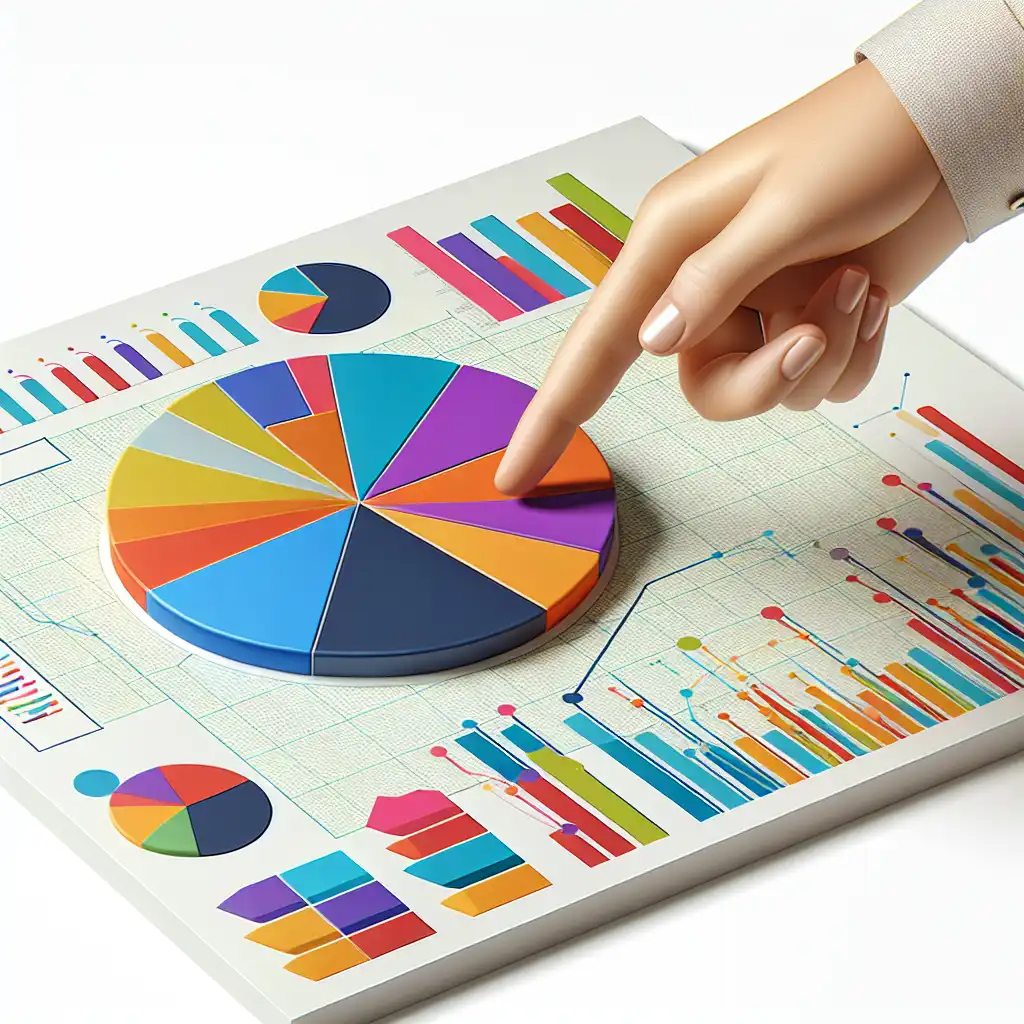
A visual display of information, usually in the form of a diagram, graph, or table.
The teacher showed a pie chart to explain the budget distribution
Often appears as...
- bar chart
- pie chart
Usage tips
Academic,Technical


Definition 1 of 5
Data Visualization
Charts present complex data simply, helping to spot trends or patterns easily.

The climate change chart illustrated temperature increases over the last century.
Types of Charts
Different charts like bar, line, or pie are used depending on what's being compared or shown.

We used a bar chart to compare the sales of different products.
Academic Use
Charts are common in classrooms for teaching and presenting facts and research findings.
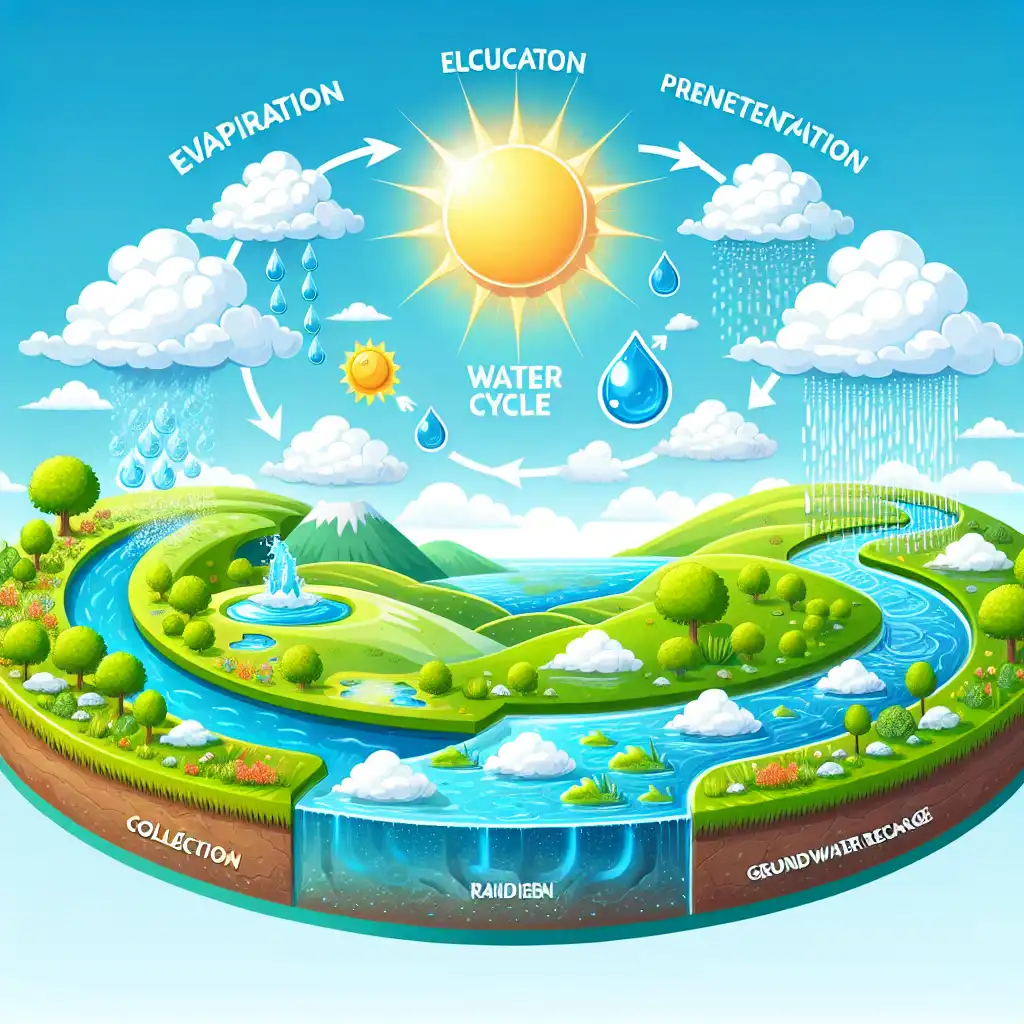
Our homework is to create a chart about the water cycle.
Compare with
blueprintdiagramgraphmapplanrecordschedulertable
Never forget "Chart"
Humans forget easily. That's why you should download WordUp: Smart reminders, word games, AI practice, and much more!


WordUp Chrome Extension
As you browse the web instantly look up words you don’t know.
Get Chrome Extension