Histogram
noun
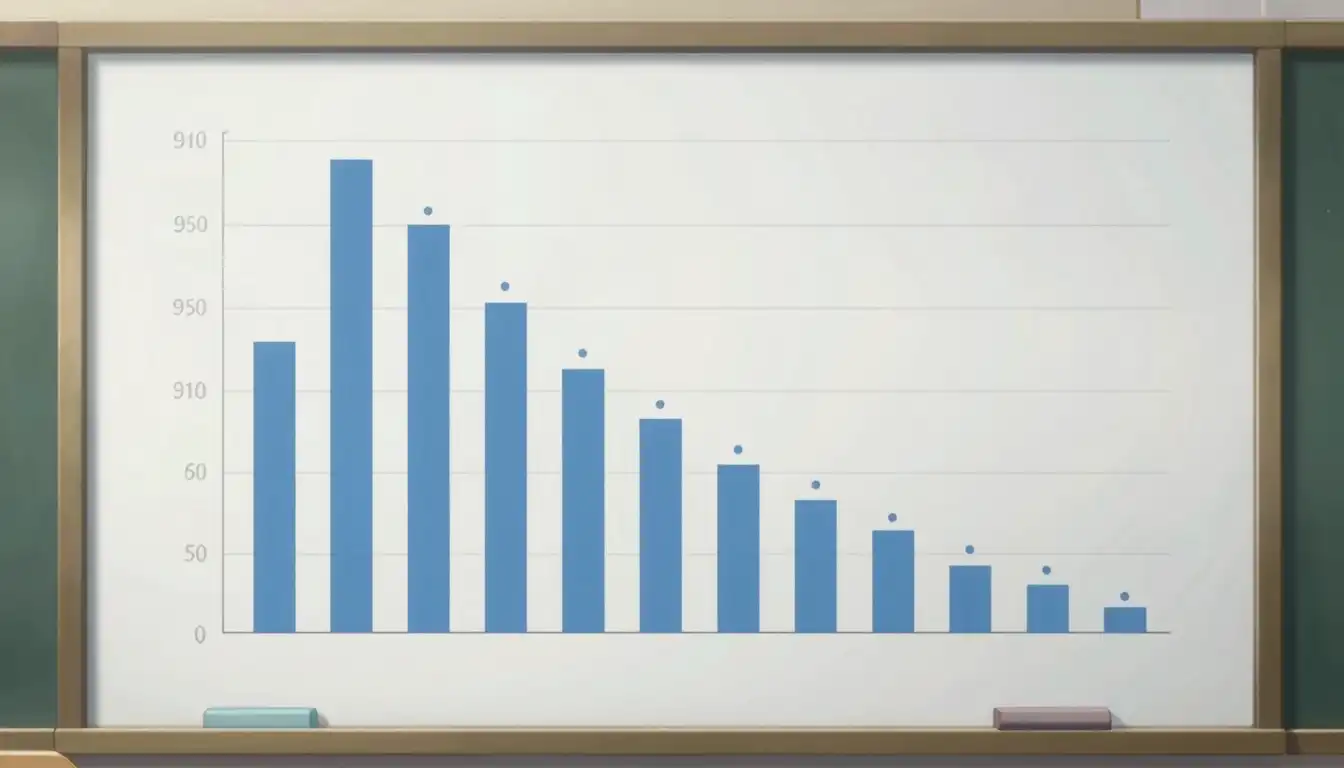
A histogram is a type of graph that displays the distribution of numerical data by showing the number of data points that fall within each range of values.
The scientist created a histogram to visualize the test scores of the students.
Often appears as...
- data analysis
- statistical graph
Usage tips
Neutral
Technical
Definition 1 of 1
Understanding Data
A histogram helps in comprehending the distribution of data points across various ranges.

Histograms allow you to see trends in data quickly.
Variance in Data
Histograms can show how much variation exists in data sets.

You can analyze the variance by observing the spread of the bars in a histogram.
Comparative Analysis
Use histograms to compare different sets of data visually.

You can compare the performance of two different groups using separate histograms.
Never forget "Histogram"
Humans forget easily. That's why you should download WordUp: Smart reminders, word games, AI practice, and much more!


WordUp Chrome Extension
As you browse the web instantly look up words you don’t know.
Get Chrome Extension